App Failing? 10 User Engagement Metrics to the Rescue


🧃 Straight to the Juice
- The key metrics are: Active Users, Session Duration and Interval, Retention, Churn, Conversion, CLV, Stickiness, and Exit Rate.
- 25% of apps are used only once and then uninstalled.
- 77% of users delete apps within the first 3 days after installation.
- Being aware of these metrics and analyzing them correctly allows for early improvements detection and increased user retention.
Have you checked on your competition lately? On a good month, the app market sees over 50,000 new releases on the Google Play Store and close to 40,000 on the Apple App Store. If that makes you nervous, it’s because it’s scary. Fierce competition puts enormous pressure on app developers.
In fact, 25% of mobile apps are used only once before they are forgotten or uninstalled. The apps that dodge deletion lose 77% of daily active users by the end of the third day. That’s a lot.
How can you avoid this or similar faith? You can track key app engagement metrics.

Measuring the number of active users, retention rate, and conversions is not only for the winners. This is not about attracting new users with fancy numbers (although you can do that, too). More importantly, these insightful engagement metrics can help you make a really successful app.
Engagement metrics are invaluable for monetizing your app. Today, we will discuss:
- Active Users
- Session Length and Interval
- Retention Rate
- Churn Rate
- Conversion Rate
- Customer Lifetime Value (CLV)
- Stickiness, Exit Rate, and Other Metrics
Deep Dive into Key Engagement Metrics
Before we dive deeper into key engagement metrics, let’s talk briefly about what it means. When we talk about “engaging” apps, we usually refer to being “hooked” on using them. But not all apps are meant to be used like that. An app is engaging when it gives its users what they want.

Successful app developers never lose sight of this distinction. Knowing that you can’t measure your app performance against benchmarks set by the likes of Facebook or TikTok can save you a lot of time and spare you a lot of disappointment. What should you measure, then? Let’s see.
Active Users
When you’re researching a new app, what is the one thing you always check before you hit download? That’s right: the number of active users. Why do you do that? What does this figure tell you, and how come developers and app stores always put it in a prominent spot?
In the app, software, and website space, the number of active users indicates whether or not you have a good digital product. This is because active users actually interact with the app. They open and use it on a regular basis, as opposed to others who forget they’ve downloaded it.
For those who like definitions, an active user is an individual who regularly engages with and uses your app and has a high user engagement score. Active users, plural, commonly refers to an engagement metric that helps gauge user satisfaction and digital product-market fit.
Defining Daily, Weekly, and Monthly Active Users
My two favorite apps are YouTube Music and DoorDash. I would say I use both of these apps all the time, even though I barely close YouTube and I only open DoorDash on Friday nights. But that’s not because I like DoorDash any less; it’s because I’m trying to change my eating habits.

The point is: When it comes to app usage, there is no universal definition of “active”. Many apps are used daily, while others are opened once a week or month. That’s why this metric has three different subtypes—daily active users, weekly active users, and monthly active users.
The standard DAU/MAU ratio (the number of days per month users engage with an app, otherwise known as “stickiness”) is 10-20%. Still, it’s important to keep in mind that industry benchmarking isn’t applicable to all apps. A better strategy is to measure active users over time.
Interpreting and Leveraging Active User Data
The number of active users interacting with your app can tell you volumes about the effectiveness of your product. Modern-day users don’t return to apps they don’t like or find difficult to use. With around 3.553 M Android apps and over 1.81 M Apple Store apps, they don’t need to.
If your active users are increasing over time, it’s a sign that you’ve created a good app that is engaging and provides value to users, whereas a declining trend implies the opposite.
On top of that, the active users metric helps you calculate other key performance indicators (KPIs), like growth, churn, and product stickiness. This figure is also crucial for determining the app’s retention rate, which ultimately translates to an important metric called lifetime value (LTV).
Strategies to Increase Active User Counts
Realizing that not many people enjoy your app could be discouraging, but it can also motivate you to develop a better product. Look at your online reviews and what people say about you on forums and social media. Then, use that feedback to increase your app’s active user counts.
Some of the best strategies for growing active users in a mobile app include:
- Simplified Onboarding—App onboarding is key to retention: It can increase the number of kept users by 150% over six months. The app introduction should be short and sweet, teaching the user how to interact with features and how to maximize the benefits.
Example: Blinkist, a popular reading app with 32 million users, invites new users to curve their own happy path by sharing their likes and interests with the app in three fun steps.
- Personalized Journeys—89% of marketers report that app personalization increases revenue. If you are not leveraging user data to personalize user experience, you will never get the figures you are hoping for. Personalization attracts, converts, and retains users.
- App Re-engagement—Find the best way to revive user interest based on your target audience and their feedback. In-app offers, push notifications, retargeting ads, and all ideas worth exploring. You can also try introducing new features or subscription plans.
Session Length and Interval
An app can have hundreds of active users interacting with its features frequently - but in different time intervals. To fully understand user behavior and engagement, you should pay attention to how often and for how long people use your app. These metrics are called session length and interval.
Understanding Session Length and Interval
Session length is the time that an average user spends on your app “in one sitting,” a.k.a. during a single session. This is a time period between two touchpoints: opening and closing an app.

The time between two consecutive sessions is called the session interval. Depending on the type of app and what it is made for, the session interval is measured in minutes, days, or weeks.
Analyzing Session Data to Identify User Behavior Patterns
Session length and interval can reveal a lot about the quality of your app, especially when analyzed in correlation with active users. If people are opening your app sporadically only to close it a couple of seconds later, that’s usually not a good sign. Your app is not keeping them engaged.
The average session length for an app is five minutes. Anything shorter than that indicates that the app is not giving users what they need and want—unless your app is made to provide quick information. Flo, a brilliant health app for women, gives me all I need to know in under a second.
It’s similar to session intervals. Longer gaps between two interactions usually mean that your app is not stirring excitement. This is especially true if the session length shows that users close it shortly after they open it. Long intervals followed by long sessions usually tell a different story.
Combining these metrics can teach you more about two crucial aspects of your app: engagement and user behavior. Sometimes, short session lengths don’t have to mean that users are losing interest. On the contrary, they might be a part of a behavioral pattern that reflects excitement.
Optimizing App Features to Encourage Longer Sessions
When it comes to app engagement, more usually means better. If measuring session length and interval repeatedly shows that users interact with your app only briefly and then go on a long hiatus before they eventually open the app again, that’s a call for immediate improvement.
Here’s what you can do to make people spend more time using your app:
- Compelling Content—81.3% of time spent on mobile apps is dedicated to video/photo and social media apps. It’s the type of format and channel preferred by today’s mobile users. Creative UX design enables you to incorporate these elements where they are not usually needed. Think personalized local tips in navigation apps or video tutorials for analytics.
- Adding Gamification—80% of consumers say that they’d be more likely to do business with a company that offers a gamified mobile app. That’s why gaming and productivity apps have the highest retention rates. Gamification keeps users engaged for longer periods by having them complete tasks and get rewarded for it. It’s all about setting goals and hunting achievements.
Example: Apps like Duolingo and Todoist have been inspiring app developers for years, but there are other good examples to learn from. We especially like story-based Zombies, Run!, a fitness app that makes you run faster and longer to escape zombies.
Retention Rate
Surely, you know that retention refers to the number of users who stay with you for a longer period of time. But is it that simple? Of course not. Measuring your app’s retention rate is of key significance for optimization and revenue forecasting and crucial for determining user loyalty.
Calculating Retention Rate
There are two ways to gauge user loyalty in the app space—by calculating the aggregate retention rate and using cohort analysis. Let’s see the difference and explain how both work.
Aggregate Retention Rate
Simply put, this is the number of new users at the end of the month measured against the total number of installs during the same time.
Monthly active users ÷ Number of installs = Aggregate Retention Rate
Cohort Retention Rate
Cohort analysis gives you more segmented insight and allows you to dive deeper into user engagement and loyalty for DAU, WAU, and MAU metrics.
DAU/WAU/MAU ÷ Daily/Weekly/Monthly Installs = Cohort Retention Rate
Factors Influencing User Retention
Why is your retention rate low or refuses to go up? Honestly, there are dozens of possible explanations for why users keep deciding to uninstall your app. Some common reasons include:
- App Onboarding—The user’s first contact with the app should feel enticing and educational but in a fun way. Successful apps use a brief step-by-step onboarding path that includes gamification elements and sets up the user for a personalized app experience.
- User Experience—Three words: seamless, engaging, and valuable. The number one reason why users uninstall apps is because they don’t use them. So, if you want better retention figures, you need to design a user experience that makes your app usable and useful.
- Personalization—84% of consumers say being treated like a person, not a number, is very important to winning their business. This applies to every industry and type of product, and mobile apps are no exception. App users demand personalized experiences.
- Regular Updates—App improvements are more than technical upgrades. While they are critical for providing a better user experience, they are also greatly appreciated by users because they show how much you care. It’s a promise that more good things will come.
- User Data Privacy—Digital product users are growing increasingly weary of their privacy options. 9 out of 10 US users consider their online privacy to be an important issue. If you can’t offer encryption and keep data away from third parties, you’ll be uninstalled.
- Customer Support—Immediate and friendly support is of special significance in app categories like tech, commerce, banking, and gambling. These apps must provide easy ways for users to contact a representative and solve a problem, be that live chat or a phone call.
Best Practices for Improving Retention Rate
Marketers like to say, “There’s no retention without attention.” Corny as that is, it’s also true. The first step to improving user loyalty is coming up with figures and determining the root cause of a declining retention rate. You should identify behavioral patterns and listen to user feedback.
In most cases, developers see sizable improvements after undoing their wrongs. User reviews play a colossal role in this, as they can tell you exactly what areas to address. If your onboarding process lacks clarity, go back and redo it. Not enough security updates? Make them more frequent.
Continuously measuring the same app retention rate is a different kind of problem. This “not great, not terrible” situation is a bit more difficult to improve because it requires out-of-the-box solutions. It is what separates average apps from over-performing apps with millions of loyal users.
If your conversion rates stay flat over time, it’s time to introduce a new feature or revisit UX design. The best apps keep users with personalization and gamification. Interactive elements improve engagement, so think about adding challenges, streaks, coachmarks, in-app messages, etc.
Industry Benchmarks for Retention Rate across Different App Categories
Ideally, your retention rate should keep increasing to show growth. But while your app is still new, and until you can measure user loyalty over time, you must have something to compare your retention rate against. That’s why app builders invest in app retention benchmark reports.
These are the industry retention rate benchmarks for popular categories:
Churn Rate
The number of users who uninstall your app in a certain timeframe can help you identify your churn rate. Churn is the opposite of retention, just the same as disengagement, which is the opposite of engagement. It happens every time a user drops your app or stops paying for a subscription.

Users uninstall apps because they are frustrated, disappointed, or disenchanted with certain aspects of the UX, so the churn rate is actually a very reliable indicator of user satisfaction.
In addition to helping you determine areas of improvement and boost customer retention, this metric is also valuable for measuring customer lifetime value (LTV). Every time you lose a user, you need to get a new one; churn can also help you calculate customer acquisition cost (CAC).
Defining and Calculating Churn Rate
The formula for calculating the churn rate includes three measured values:
Number of uninstalls ÷ (Total number of users + Acquired users) = Churn rate
You can calculate the churn rate for any given timeframe. For example, the monthly churn rate is the number of users who’ve installed the app during the month divided by the number of users you had at the beginning of the month and the new users you’ve acquired over that time.
Identifying Reasons for User Churn
Earlier, we mentioned that the number one reason people delete apps is because they stop using them. Why do they do that, though? Confusing app onboarding and navigation are often a reason enough. Other explanations include technical issues, price increases, and user boredom.
Can you identify specific reasons for user churn? Sure. You can employ analytical tools and monitor user behavior. This can help you pinpoint roadblocks in individual user journeys and analyze this behavior at a scale. If there is a specific problem that triggers uninstalls, analytics will show it.
Customer feedback can provide insightful answers, too. Track user complaints across platforms and see if certain keywords repeat more often than others. You should also talk to your customer support team. If somebody understands why people experience problems with your app, it’s them.
Implementing Strategies to Reduce Churn Rate
Low or high, the churn rate must be reduced. In ideal circumstances, your number of uninstalls should be zero. However impossible to achieve, the near-zero churn rate makes a good objective. It keeps app developers out of their comfort zone and constantly striving toward perfection.
With that, here are some strategies that can help you reduce your churn rate:
- Cohort Analysis—To answer why users churn, you must ask yourself when users churn. Cohort analysis is very insightful when it comes to this, as it can identify how loyal users interact with the app and what actions they complete vs what other users do before they churn.
- Fix Churn Leaks—When cohort analysis identifies “churn leaks,” a.k.a. spots in your app’s user journey or happy path that typically precede churn, plug them. For example, if you detect that many users delete the app immediately after they abandon the cart, that could mean they are frustrated with the purchase process or alienated by the paying options or price.
- Engage, engage! Sometimes, churn happens in random spots because the general impression of the app is underwhelming. This means that you have to work harder to engage users and give them a reason to stay. Gamification and push notifications deliver great results.
Conversion Rate
Is there a more important metric for app developers than conversion rate? Hardly. And you don’t have to run an e-commerce app to feel its significance. Contrary to popular belief, conversions are not only about turning users into paying customers; they are about users completing key actions.
Understanding Conversion Rate in the Context of Mobile Apps
The conversion rate is the number of users who have taken a desirable action in your app. This can be anything from clicking an ad to making a purchase. Obviously, this metric fully depends on your app monetization model and whether you convert users in-app or on your website.
Do you want to hear some good news? Customers prefer mobile apps to mobile websites. Only 20% of shopping carts get abandoned in mobile apps, compared to 68% on websites and 97% on mobile sites! The best apps transform shopping into a fast, convenient, and fun experience.
The conversion rate measures all this. It holds a mirror to your app’s effectiveness, user experience, and engagement. Furthermore, the conversion rate helps analyze and manage your revenue streams and resource allocation and lowers your sales and customer acquisition costs (CAC).
Tracking and Optimizing Conversion Rates for Key In-App Actions
Calculating the conversion rate for a mobile app is easy enough with this formula:
Number of successful conversions ÷ Total number of users = Conversion rate
Ultimately, it shows how many users have finished their customer journey using your app compared to how many users have used your app, full stop. What counts as a conversion depends solely on your app strategy: environmental non-profits convert users simply by making them sign up.
What can you do to improve your app’s likelihood of converting users? Everything!
- Design a Flawless UX with Zero Interruptions
Conversion is the pinnacle of the user’s journey, so every aspect of your app should work together to lead the user to this point. UX design plays a star role in this. If users don’t find your app enjoyable and easy to use, they will become idle or churn. The UX must be fluid and frictionless.
- Personalize App Content and Recommendations
A mind-blowing 91% of consumers are more likely to shop with brands that recognize, remember, and provide relevant offers and recommendations. Personalization can boost conversions by 20%. The best personalization practices include push notifications and smart recommendations.
- Help / Incentivize Users to Take the Next Step
App analytics can help you determine friction points in journeys that users take on their way to making a conversion. Pinpoint a problematic spot and give users a good reason to move past that. For example, you can offer a discount or reward or simply provide a tip for completing an action.
- Create a Sense of Urgency for Critical Actions
Did your monitoring tool ever register a user who kept returning to the same subscription options page and leaving without taking the final step? The best way to deal with indecisive users is with a ticking clock. Set the timer for a limited offer or highlight the number of items left in store.
- Create Unavoidable Call-to-Actions (CTAs)
A call-to-action (CTA) button surrounded by fewer elements and more white space can reportedly boost conversion rates by 232%! Whether this is exaggerated or not, it’s beyond doubt that well-crafted CTAs have the power to push consumers over the edge and down the sales funnel.
- A/B Testing to Improve Conversion Rates
In A/B testing, the two different versions of the app are compared for user engagement and conversion potential. You can use A/B testing to measure the effectiveness of every app element, from key features to the color of your CTAs. It will improve the app’s UX and maximize your ROI.
Customer Lifetime Value (CLV)
Even more valuable than customer conversion, long-term customer satisfaction and excellence can turn an app into a well-oiled machine for revenue generation. Excel in all the metrics we’ve discussed, and you will notice an exciting trend: your customer lifetime value (CLV) will go up.
What is CLV, exactly? The customer lifetime value is a critical performance indicator that shows the overall profitability of your average customer. High CLV rates indicate customer loyalty measured in repeat purchases, long-term subscriptions, and profit over time.
Calculating CLV for Mobile App Users
Customer lifetime value is the mother of all engagement metrics, so it could be challenging to calculate. It involves various factors: the average revenue per user and the average lifespan of a consumer on one side and customer acquisition, conversion, and retention costs on the other.
A simplified formula for measuring customer lifetime value looks like this:
Customer Value x Average Customer Lifespan = Customer Lifetime Value
While measuring the average customer lifespan is relatively easy (the total number of years that existing customers have stayed active divided by the total number of customers), determining customer value involves the average revenue per customer and the frequency of spending.
Using CLV Insights to Optimize User Acquisition and Retention Strategies
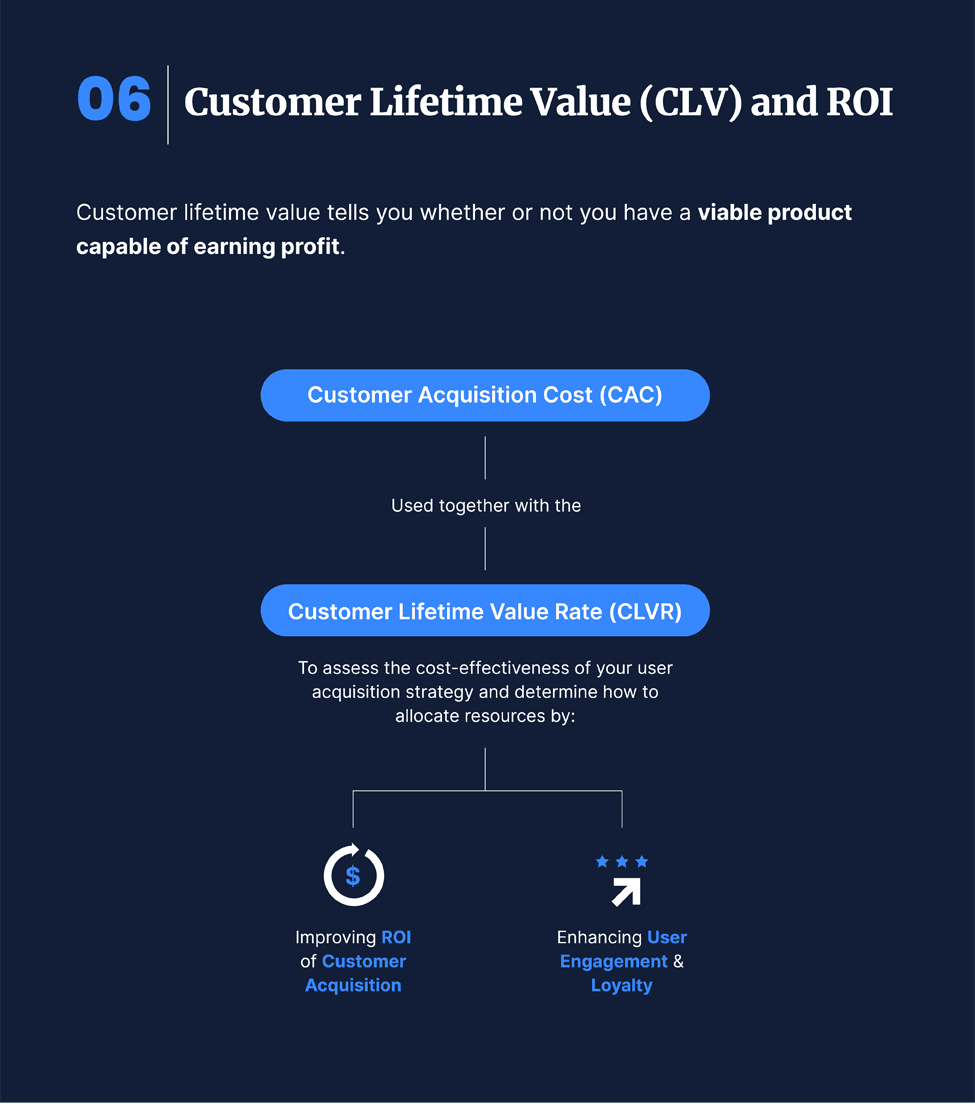
Ultimately, the CLV rate provides an answer to a question on every app developer’s mind: “Is all this worth it?” In other words, customer lifetime value tells you whether or not you have a viable product capable of earning profit; having a high CLV means you can finally take a vacation.

What about a low CLV, then? Does it mean you’re slowly sinking into bankruptcy?
It doesn’t have to, no. Measuring a lower-than-expected customer lifetime value can help you optimize user acquisition and improve your retention rates. This is invaluable insight that can inform your entire app strategy going forth. Here’s how to use CLV to maximize your bottom line:
- Improve ROI of Customer Acquisition—You’re probably aware that acquiring a new customer is up to 5 times more expensive than retaining an existing one. Getting people to use your app can eat up all your resources. Fortunately, measuring CLV helps avoid that.
The customer lifetime value rate (CLVR) can be used together with the customer acquisition cost (CAC) to assess the cost-effectiveness of your user acquisition strategy and determine how to allocate resources for marketing, lead generation, and conversion tactics.
- Enhance User Engagement & Loyalty—Did you know that a 5% increase in customer retention can increase profit by 25 to 95%? Measuring CLV can help identify factors that contribute to churn and tell you how to address them, thus directly boosting retention.
Additionally, CLV helps you differentiate between non-profitable, profitable, and very profitable customers and calibrate your engagement strategy accordingly. Your customer support team can dedicate extra attention to high spenders, rewarding them for their loyalty.
Stickiness, Exit Rate, Time in App, and Other Metrics
Of course, this is not all. There are many other metrics that can help you improve the quality of your app and boost user engagement. The more of them you use, the finer the results. Comprehensive measuring allows you to assess your app holistically and perfect UX for specific user bases.

Stickiness
Stickiness measures how often users return to an app and how long they spend using it. It gives depth to data provided by gauging session length and intervals, ultimately painting a broader picture of user behavior and app engagement. The most popular apps are the stickiest.
Session Depth
Session depth counts the number of pages an average user visits per session. What it means is different for different app types and categories. Sometimes, it means that users are having fun browsing around; in other situations, it indicates they are lost looking for the information they need.
Exit Rate
The exit rate is the percentage of exits on a particular page regardless of session length. If this seems super-specific, that is because it is. Nevertheless, you will never be able to pinpoint friction points and churn leaks without knowing the last page users interact with before bouncing.
Time In-App
Have you ever wondered how much time a typical user spends in your app? That’s what this metric is for. Time in-app measures the total amount of time a user spends interacting with your app over a given period of time, and it’s especially useful for content-based apps like social media.
Most Visited
What are your app’s key selling points (KSPs), and how are they impacting key performance indicators (KPIs)? The metric that allows you to answer this question is the “most visited” rate, which allows you to see what pages, content, and actions perform as the best drivers of engagement.
Screen Flow
Measuring screen flow can help you enter your average user’s mind. This metric reveals how people interact with different aspects of your app and in which order. What leads them where, and how did they get there in the first place? This is a brilliant way to analyze user behavior.
Conclusion
User engagement metrics can help you understand what makes a good app. Even more importantly, they tell you what makes your app good - and what isn’t. Both insights are invaluable. You can use data from engagement metrics to improve all areas of UX and boost your app’s strategic value.
Will that be enough to keep your app around? It will certainly increase your likelihood for success. One thing is certain: industry-leading app developers prioritize engagement tracking and optimization. Even lesser ones admit they would’ve been more successful if they measured engagement.
FAQ
What are the most critical user engagement metrics for mobile apps?
The key metrics for measuring user engagement for a mobile app are the number of active users, session length and interval, retention rate, churn rate, conversion rate, and customer lifetime value (CLV).
How often should app developers review and analyze engagement metrics?
Different apps dictate different measurement techniques and frequencies. In general, you should review and analyze engagement metrics for your app daily, weekly, or monthly, depending on how many users you have.
What are some common mistakes app developers make when tracking engagement metrics?
The biggest and most common mistake made by app developers is presuming that all users count as “active users,” thereby measuring DAY by the number of logins. Another frequent mistake is thinking that longer app sessions indicate a higher engagement rate, whereas users often spend more time in-app trying to figure it out. This explains why long sessions are often followed by “sudden” churns.
How can app developers balance user engagement with other priorities, such as monetization and user acquisition?
Key user engagement metrics, such as user retention, conversion, and customer lifetime value (CLV) indicate the overall effectiveness and profitability of a mobile app. They can help determine the cost of acquisition and allocate resources accordingly. Moreover, engagement metrics can help eliminate churn risks and improve UX in a way that enhances user satisfaction and long-term retention.
What are some emerging trends in mobile app user engagement that developers should be aware of?
The biggest mobile app engagement trend that developers must keep an eye on is AI. Machine learning and predictive analysis can completely transform UX design by making it fully personalized and add fuel to the market’s competitiveness with all-knowing and real-time analytics. In addition to that, users might start insisting on interactive apps that incorporate AI and VR technology, as well as enhanced data security brought by blockchain.


Keep reading


.webp)


Time for
your exit?